Edit chart
Loading graph
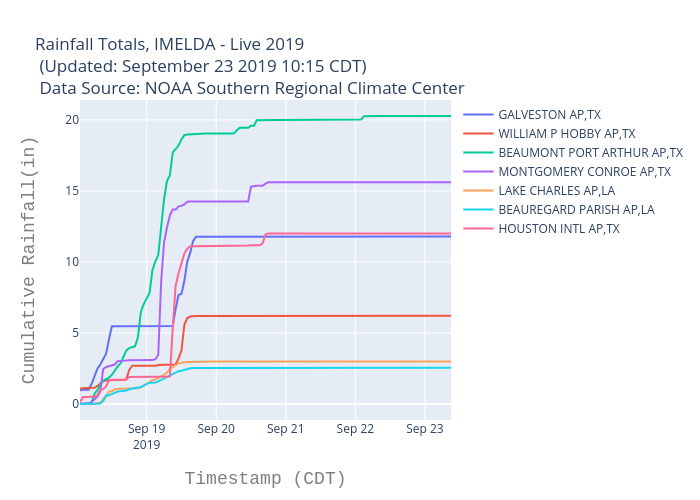
Bigdata153's interactive graph and data of "Rainfall Totals, IMELDA - Live 2019 (Updated: September 23 2019 10:15 CDT) Data Source: NOAA Southern Regional Climate Center" is a scatter chart, showing GALVESTON AP,TX, WILLIAM P HOBBY AP,TX, BEAUMONT PORT ARTHUR AP,TX, MONTGOMERY CONROE AP,TX, LAKE CHARLES AP,LA, BEAUREGARD PARISH AP,LA, HOUSTON INTL AP,TX; with Timestamp (CDT) in the x-axis and Cumulative Rainfall(in) in the y-axis.. The x-axis shows values from 0 to 0. The y-axis shows values from 0 to 0.